Kód: 04376323
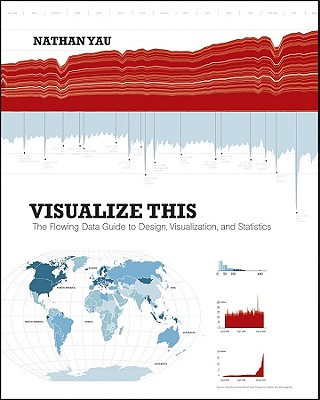
Visualize This - The FlowingData Guide to Design, Visualization and Statistics
Autor Nathan Yau
Practical data design tips from a data visualization expert of the modern age Data doesn't decrease; it is ever-increasing and can be overwhelming to organize in a way that makes sense to its intended audience. Wouldn't it be won ... celý popis
- Jazyk:
 Angličtina
 - Väzba: Brožovaná
- Počet strán: 384
Nakladateľ: John Wiley & Sons Inc, 2011
- Viac informácií o knihe

46.55 €
Bežne: 49 €
Ušetríte 2.45 €

Skladom u dodávateľa
Odosielame za 14 - 18 dní
Mohlo by sa vám tiež páčiť
-

Wall Street Journal Guide to Information Graphics
23.62 € -20 % -

Practical Guide to Information Design
47.35 € -
Storytelling with Data - Let`s Practice!
35.89 € -15 % -

The Big Book of Dashboards
42.53 € -15 % -
Storytelling with Data
35.89 € -15 % -

Nformation Design Handbook
54.49 € -

Data Visualisation
73.60 € -
Functional Art, The
46.35 € -

Change by Design
23.12 € -17 % -

Quiet
24.53 € -20 % -

Fight Club 3
35.69 € -11 % -

Understanding the World. The Atlas of Infographics
40.51 € -5 % -

Loyalty Effect
26.34 € -

The Siege of Vukovar
19.86 € -
New Playful Data: Graphic Design and Illustration for Infographics
33.98 € -19 % -

Tarot Correspondences
26.03 € -15 % -

How Charts Lie
26.54 € -10 % -

Komi Can't Communicate, Vol. 2
8.84 € -23 % -

English Grammar in Use 5th edition
30.96 € -

Oracle of the Radiant Sun: Astrology Cards to Illuminate Your Life
30.66 € -

Research Methodology
54.39 € -

All the Young Dudes
12.46 € -3 % -

Chaos Walking Boxed Set
24.83 € -17 % -

Notorious - The Life and Fights of Conor McGregor
10.95 € -23 % -
Better Data Visualizations
34.38 € -3 % -

Methods in iPSC Technology
187.13 € -

God of Wrath
27.54 € -

Tasty. Healthy. Cheap.
18.19 € -4 % -

52 Weeks of Scarves
20.50 € -23 % -

How Charts Work
18.39 € -23 % -

Data Visualization Handbook
84.36 € -5 % -

Unwanted Undead Adventurer (Manga): Volume 1
13.56 € -15 % -

Influence, New and Expanded UK
20.50 € -23 % -

Midnight Sun
9.54 € -19 % -

Social Class in Europe
23.92 € -

Rebuilding Milo
59.12 € -15 % -

Hekate
16.78 € -6 % -

Puzzle High Quality Collection New York 13200
67.87 € -

Tender Is the Flesh
16.08 € -14 % -

Trustworthy Online Controlled Experiments
37.30 € -11 % -

The Star Tarot
34.38 € -3 % -

Lonely Planet Germany, Austria & Switzerland's Best Trips
17.29 € -23 % -

Wisdom of the Oracle Divination Cards
19.80 € -20 % -

Intelligent Investor
26.94 € -23 % -

Physically Based Rendering
107.38 € -10 % -

Inner Work
15.27 € -14 % -

Republic
9.44 € -14 % -

The Very Hungry Caterpillar
7.93 € -22 % -

Leading
13.36 € -19 % -

100 Deadly Skills
20.40 € -2 % -

The Art of Japanese Joinery
26.74 € -3 % -

Adventures of Sherlock Holmes and Other Stories
20.70 € -19 % -

Titan
23.92 € -10 % -

The Life of a Stupid Man
3.91 € -15 % -

Pinball Compendium: 1930s-1960s
58.82 € -

Rebecca
10.95 € -23 % -

Qualitative Research from Start to Finish
71.69 € -

Little Women
6.93 € -

My Heart and Other Black Holes
11.55 € -

Gravity Falls Journal 3
21.71 € -

Elements of Style
6.22 € -

Naked Statistics
16.28 € -10 % -

Twilight Garden Coloring Book
15.07 € -18 % -
Visual Thinking
21.71 € -18 % -

Soviet Bus Stops Volume II
32.07 € -8 % -

Seitai (Lymphatic) Shiatsu, Cupping and Gua Sha for a Healthy Immune System
41.02 € -

Warriors: A Vision of Shadows #4: Darkest Night
7.73 € -23 % -

Archer's Voice
14.07 € -20 % -

Mindfulness Cards
19.80 € -1 % -

Podolí
4.92 € -16 % -

Meč králů
11.05 € -20 % -

Storytelling danych Poradnik wizualizacji danych dla profesjonalistów
17.18 € -12 % -

Zwierzęta prehistoryczne. Maluszkowe malowanie
0.39 € -17 % -

Terapeutka
9.84 € -

Kod emocji. Jak uwolnić zablokowane emocje i cieszyć się zdrowiem, szczęściem oraz miłością.
11.76 € -16 % -

Biblia Infográfica (Bible Infographics for Kids)
15.98 € -

Jezyk polski Jak analizowac proze
5.62 €
Darujte túto knihu ešte dnes
- Objednajte knihu a vyberte Zaslať ako darček.
- Obratom obdržíte darovací poukaz na knihu, ktorý môžete ihneď odovzdať obdarovanému.
- Knihu zašleme na adresu obdarovaného, o nič sa nestaráte.
Viac informácií o knihe Visualize This - The FlowingData Guide to Design, Visualization and Statistics
Nákupom získate 117 bodov
 Anotácia knihy
Practical data design tips from a data visualization expert of the modern age Data doesn't decrease; it is ever-increasing and can be overwhelming to organize in a way that makes sense to its intended audience. Wouldn't it be wonderful if we could actually visualize data in such a way that we could maximize its potential and tell a story in a clear, concise manner? Thanks to the creative genius of Nathan Yau, we can. With this full-color book, data visualization guru and author Nathan Yau uses step-by-step tutorials to show you how to visualize and tell stories with data. He explains how to gather, parse, and format data and then design high quality graphics that help you explore and present patterns, outliers, and relationships. Presents a unique approach to visualizing and telling stories with data, from a data visualization expert and the creator of flowingdata.com, Nathan Yau Offers step-by-step tutorials and practical design tips for creating statistical graphics, geographical maps, and information design to find meaning in the numbers Details tools that can be used to visualize data-native graphics for the Web, such as ActionScript, Flash libraries, PHP, and JavaScript and tools to design graphics for print, such as R and Illustrator Contains numerous examples and descriptions of patterns and outliers and explains how to show them Visualize This demonstrates how to explain data visually so that you can present your information in a way that is easy to understand and appealing.
 Parametre knihy
Zaradenie knihy Knihy po anglicky Computing & information technology Computer science Artificial intelligence
46.55 €
- Celý názov: Visualize This - The FlowingData Guide to Design, Visualization and Statistics
- Autor: Nathan Yau
- Jazyk:
 Angličtina
 - Väzba: Brožovaná
- Počet strán: 384
- EAN: 9780470944882
- ISBN: 0470944889
- ID: 04376323
- Nakladateľ: John Wiley & Sons Inc
- Hmotnosť: 764 g
- Rozmery: 232 × 188 × 19 mm
- Dátum vydania: 30. June 2011
Obľúbené z iného súdka
-

Introducing MLOps
55.80 € -15 % -

Algorithms for Image Processing and Computer Vision
118.55 € -

Dive into Deep Learning
34.18 € -

Python Machine Learning
59.52 € -

Machine Learning Design Patterns
55.90 € -14 % -

Deep Learning
15.17 € -15 % -

Probabilistic Machine Learning
148.31 € -

AI and Machine Learning For Coders
55.90 € -14 % -

Perceptrons
80.74 € -

Neural Networks and Deep Learning
78.73 € -5 % -

Heuristic Search
120.05 € -

Maschinelles Lernen - Grundlagen und Anwendungen
46.25 € -

Real-Time C++
68.77 € -

Artificial Intelligence
70.88 € -

Deep Learning
103.66 € -

Advances in Financial Machine Learning
44.94 € -23 % -

On Intelligence
17.69 € -15 % -

Pattern Recognition and Machine Learning
96.83 € -

Artificial Intelligence Basics
38.40 € -15 % -

Pattern Recognition and Machine Learning
128.50 € -

Creativity Code
9.34 € -21 % -

Python Machine Learning -
46.45 € -

Practical MLOps
72.89 € -15 % -

Why Greatness Cannot Be Planned
28.55 € -14 % -

Words and Rules
20.81 € -6 % -

Advanced API Security
38.40 € -15 % -

Dancing with Qubits
56.20 € -

Probabilistic Graphical Models
136.65 € -12 % -

Superminds
12.06 € -22 % -

Virtual and Augmented Reality for Automobile Industry: Innovation Vision and Applications
245.65 € -

Deep Learning
91.50 € -

Neural Networks and Deep Learning
71.49 € -

Computer Vision
66.06 € -

Programming Machine Learning
46.04 € -3 % -

Deep Learning and the Game of Go
58.21 € -5 % -

AI for Games Developers
32.97 € -15 % -

Artificial Intelligence with Common LISP
118.85 € -

Artificial Intelligence: A Modern Approach, Global Edition
72.59 € -5 % -

Book of Why
11.45 € -19 % -

Reinforcement Learning
103.66 € -

Dialogue and Instruction, 1
68.77 € -

Hands-On Machine Learning with Scikit-Learn and TensorFlow
49.66 € -

We have been harmonised
12.36 € -13 % -

Machine Learning
122.07 € -12 % -

Learning OpenCV 3
89.18 € -

Practical Machine Learning with Python
99.34 € -

Understanding Machine Learning
64.95 € -7 % -

Natural Language Processing in Action
57.21 € -

Deep Learning for Natural Language Processing
60.52 €
Osobný odber Bratislava a 2642 dalších
Copyright ©2008-24 najlacnejsie-knihy.sk Všetky práva vyhradenéSúkromieCookies


 21 miliónov titulov
 Vrátenie do mesiaca
 02/210 210 99 (8-15.30h)